The National OGSE Blueprint (OGSE Blueprint) 2021-2030 was launched in April 2021 by Minister in the Prime Minister’s Department (Economy) to develop a robust, resilient and globally-competitive Malaysian OGSE sector which contributes to the sustainable development of National priorities.
The implementation and progress of the OGSE Blueprint is coordinated by Malaysia Petroleum Resources Corporation (MPRC), an agency under the supervision of the Ministry of Economy tasked with advancing the OGSE sector.
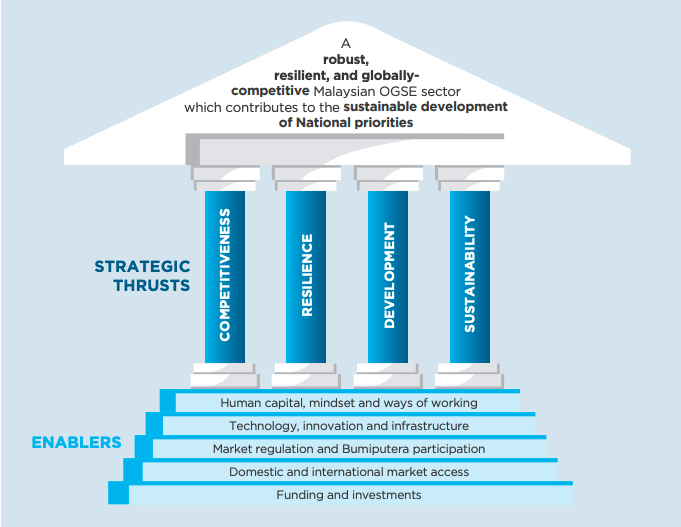
National OGSE Industry Blueprint’s Vision Statement
GDP Contribution
RM50 B
RM20-40 B
Industry profit-before-tax margin*
10%
~4%
Revenue per worker
RM1.4 M
RM1.2 M
Revenue per company*
RM60 M
~RM25 M
Exports as a proportion of total revenue
50%
32%
Proportion of listed companies in the industry
2%
1%
Market share of SMEs*
Maximum of 10%
10%
Number of billion-ringgit companies.
20
8
% of R&D expenditure by OGSE sector out of total revenues
Increase 5% from 2025
N/A
Number of skilled and semi-skilled workers
60,000
57,000
Number of OGSE companies reporting sustainability practices.
70
32
Number of OGSE PLCs in the F4GBM Index
9
6
Proportion of revenues derived outside of O&G
25%
12%
(Higher percentage is better)
Pipeline of VDP graduates
60
30
Total revenue for Sabah and Sarawak core OGSE companies
Increase 5x from baseline
RM6.4 B (2022)
XX Target end-state, 2030
XX Baseline based on 2019
XX Baseline (latest year available)
*Based on the 1,883 core OGSE companies in FY2024


1. Centralisation of OGSE Bumiputera assistance
For any enquiries, contact our Administrator
Whilst every effort has been made to ensure the accuracy of the information contained in this microsite, Malaysia Petroleum Resources Corporation accepts no responsibility for any errors it may contain, or for any loss, financial or otherwise, sustained by any person using the information. We do not endorse or promote any specific financial institution or facility, nor do we guarantee the accuracy or completeness of the information provided. Please note that the financial facilities, products, and services mentioned on our website may change over time, and we do not guarantee the availability or suitability of any specific facility or service. Should there be inaccuracies, please write to us at i-ogse@mprc.gov.my
Copyright © 2023 MPRC. All Rights Reserved. Term & Conditions
| Key Indicator | Latest figure |
|---|---|
|
Industry Profit-before-tax
|
|
|
Export as a proportion of total revenue
|
|
| Key Indicator | Latest figure |
|---|---|
|
Revenue per worker |
(Total Revenue Source: OGSE100 FY2023) (Total Number of Workers Source: BCG Analysis for OGSE Blueprint, 2019) |
|
Revenue per company |
(Source: OGSE100 FY2023) |
|
Quick Ratio |
(Source: 26 OGSE PLCs Annual report FY2023) |
|
Altman-Z Score |
(Source: 26 OGSE PLCs Annual report FY2023) |
|
Debt-to-Equity Ratio |
(Source: 26 OGSE PLCs Annual report FY2023) |
|
Proportion of revenues derived outside of O&G |
(Source: 26 OGSE PLCs Annual report FY2023) |
|
Number of OGSE patent families with local inventors filed in last 5 years |
(Source: Intellectual Property Corporation of Malaysia (MyIPO), OGSE Development Grant (DG), MPRC Internal Analysis |
| Key Indicator | Latest figure |
|---|---|
|
Number of OGSE100 companies reporting sustainability practices |
|
|
Number of companies in the Dow Jones Sustainability Index |
|
| Key Indicator | Latest figure |
|---|---|
|
Pipeline of VDP graduates
|
|
|
Proportion of listed companies in the industry
|
|
|
Market share of SMEs |
|
|
Number of billion-ringgit companies
|
|
|
Proportion of local principals in the industry |
|